Navigation

- Home |
- Gallery |
- API Docs »
- wx.lib »
- wx.lib.floatcanvas »
- wx.lib.floatcanvas.FCObjects »
- wx.lib.floatcanvas.FCObjects.PieChart
- index
- modules |
- next |
- previous |

 wx.lib.floatcanvas.FCObjects.PieChart
This is DrawObject for a pie chart
You can pass in a bunch of values, and it will draw a pie chart for you, and it will make the chart, scaling the size of each “slice” to match your values.
 Known Superclasses
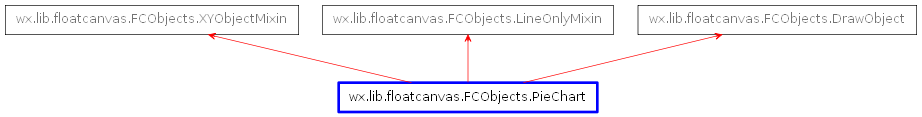
wx.lib.floatcanvas.FCObjects.DrawObject, wx.lib.floatcanvas.FCObjects.LineOnlyMixin, wx.lib.floatcanvas.FCObjects.XYObjectMixin
 Methods Summary
__init__ |
Default class constructor. |
CalcBoundingBox |
Calculate the bounding box. |
CalculatePoints |
Calculate the points. |
SetBrushes |
Set the Brushes. |
SetFillColors |
Set the FillColors and update the Brushes. |
SetFillStyles |
Set te FillStyles and update the Brushes. |
SetValues |
Set the values and calculate the points. |
 Class API
PieChart(XYObjectMixin, LineOnlyMixin, DrawObject)¶This is DrawObject for a pie chart
You can pass in a bunch of values, and it will draw a pie chart for you, and it will make the chart, scaling the size of each “slice” to match your values.
__init__(self, XY, Diameter, Values, FillColors=None, FillStyles=None, LineColor = None, LineStyle = "Solid", LineWidth = 1, Scaled = True, InForeground = False)¶Default class constructor.
| Parameters: |
|
|---|
CalcBoundingBox(self)¶Calculate the bounding box.
CalculatePoints(self)¶Calculate the points.
SetBrushes(self)¶Set the Brushes.
SetFillColors(self, FillColors)¶Set the FillColors and update the Brushes.
| Parameters: | FillColors – sequence of colors |
|---|
SetFillStyles(self, FillStyles)¶Set te FillStyles and update the Brushes.
| Parameters: | FillStyles – Fill style you want (“Solid”, “Hash”, etc) |
|---|
SetValues(self, Values)¶Set the values and calculate the points.
| Parameters: | Values – sequence of values you want to use for the chart |
|---|


 Inheritance diagram for class PieChart: